Fig. 1. Body weight (A) and glycemia (B) in T1DM (STZ-treated) and healthy (CTR) mice for 10 weeks after STZ administration. Week -1 in glycemia graph refers to glycemia one week before STZ administration. (*p< 0.05 STZ vs Control).
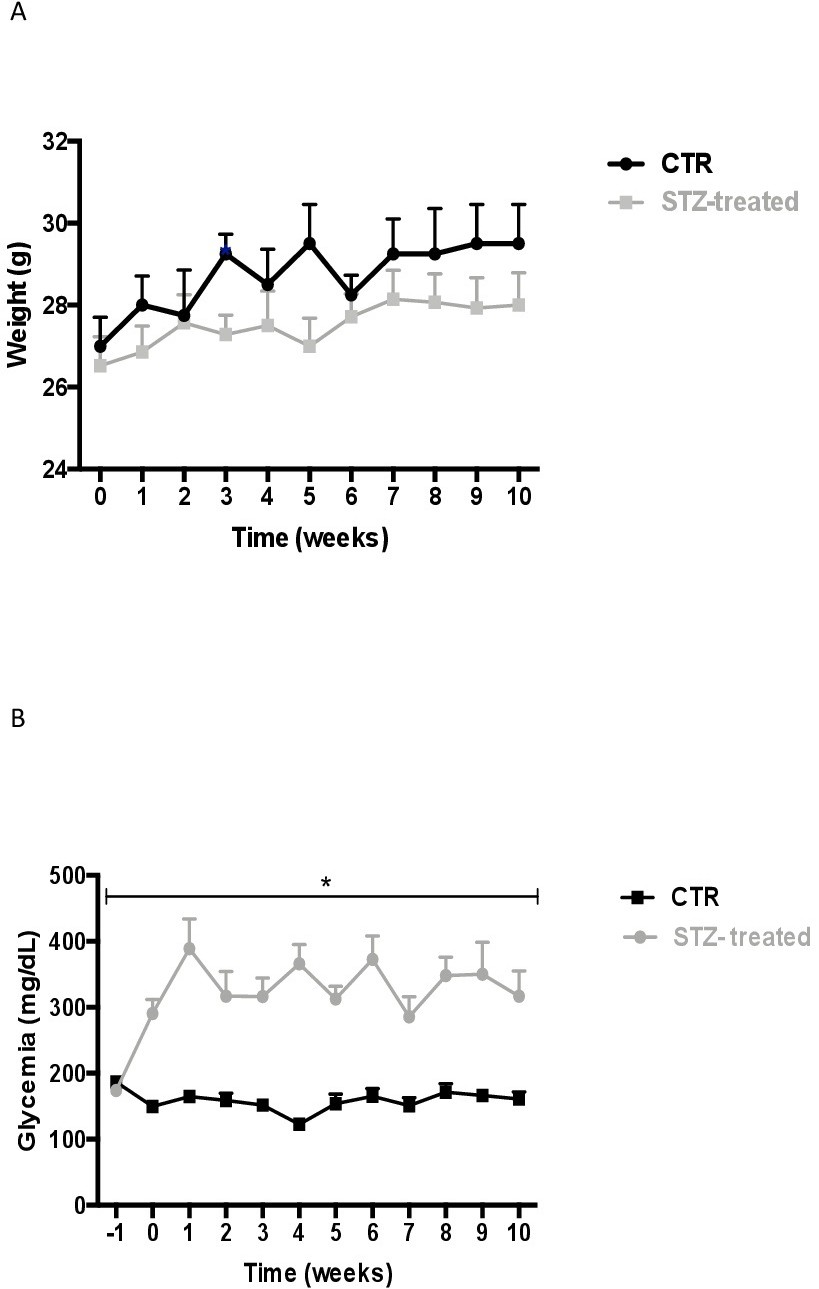
Fig. 1. Body weight (A) and glycemia (B) in T1DM (STZ-treated) and healthy (CTR) mice for 10 weeks after STZ administration. Week -1 in glycemia graph refers to glycemia one week before STZ administration. (*p< 0.05 STZ vs Control).